

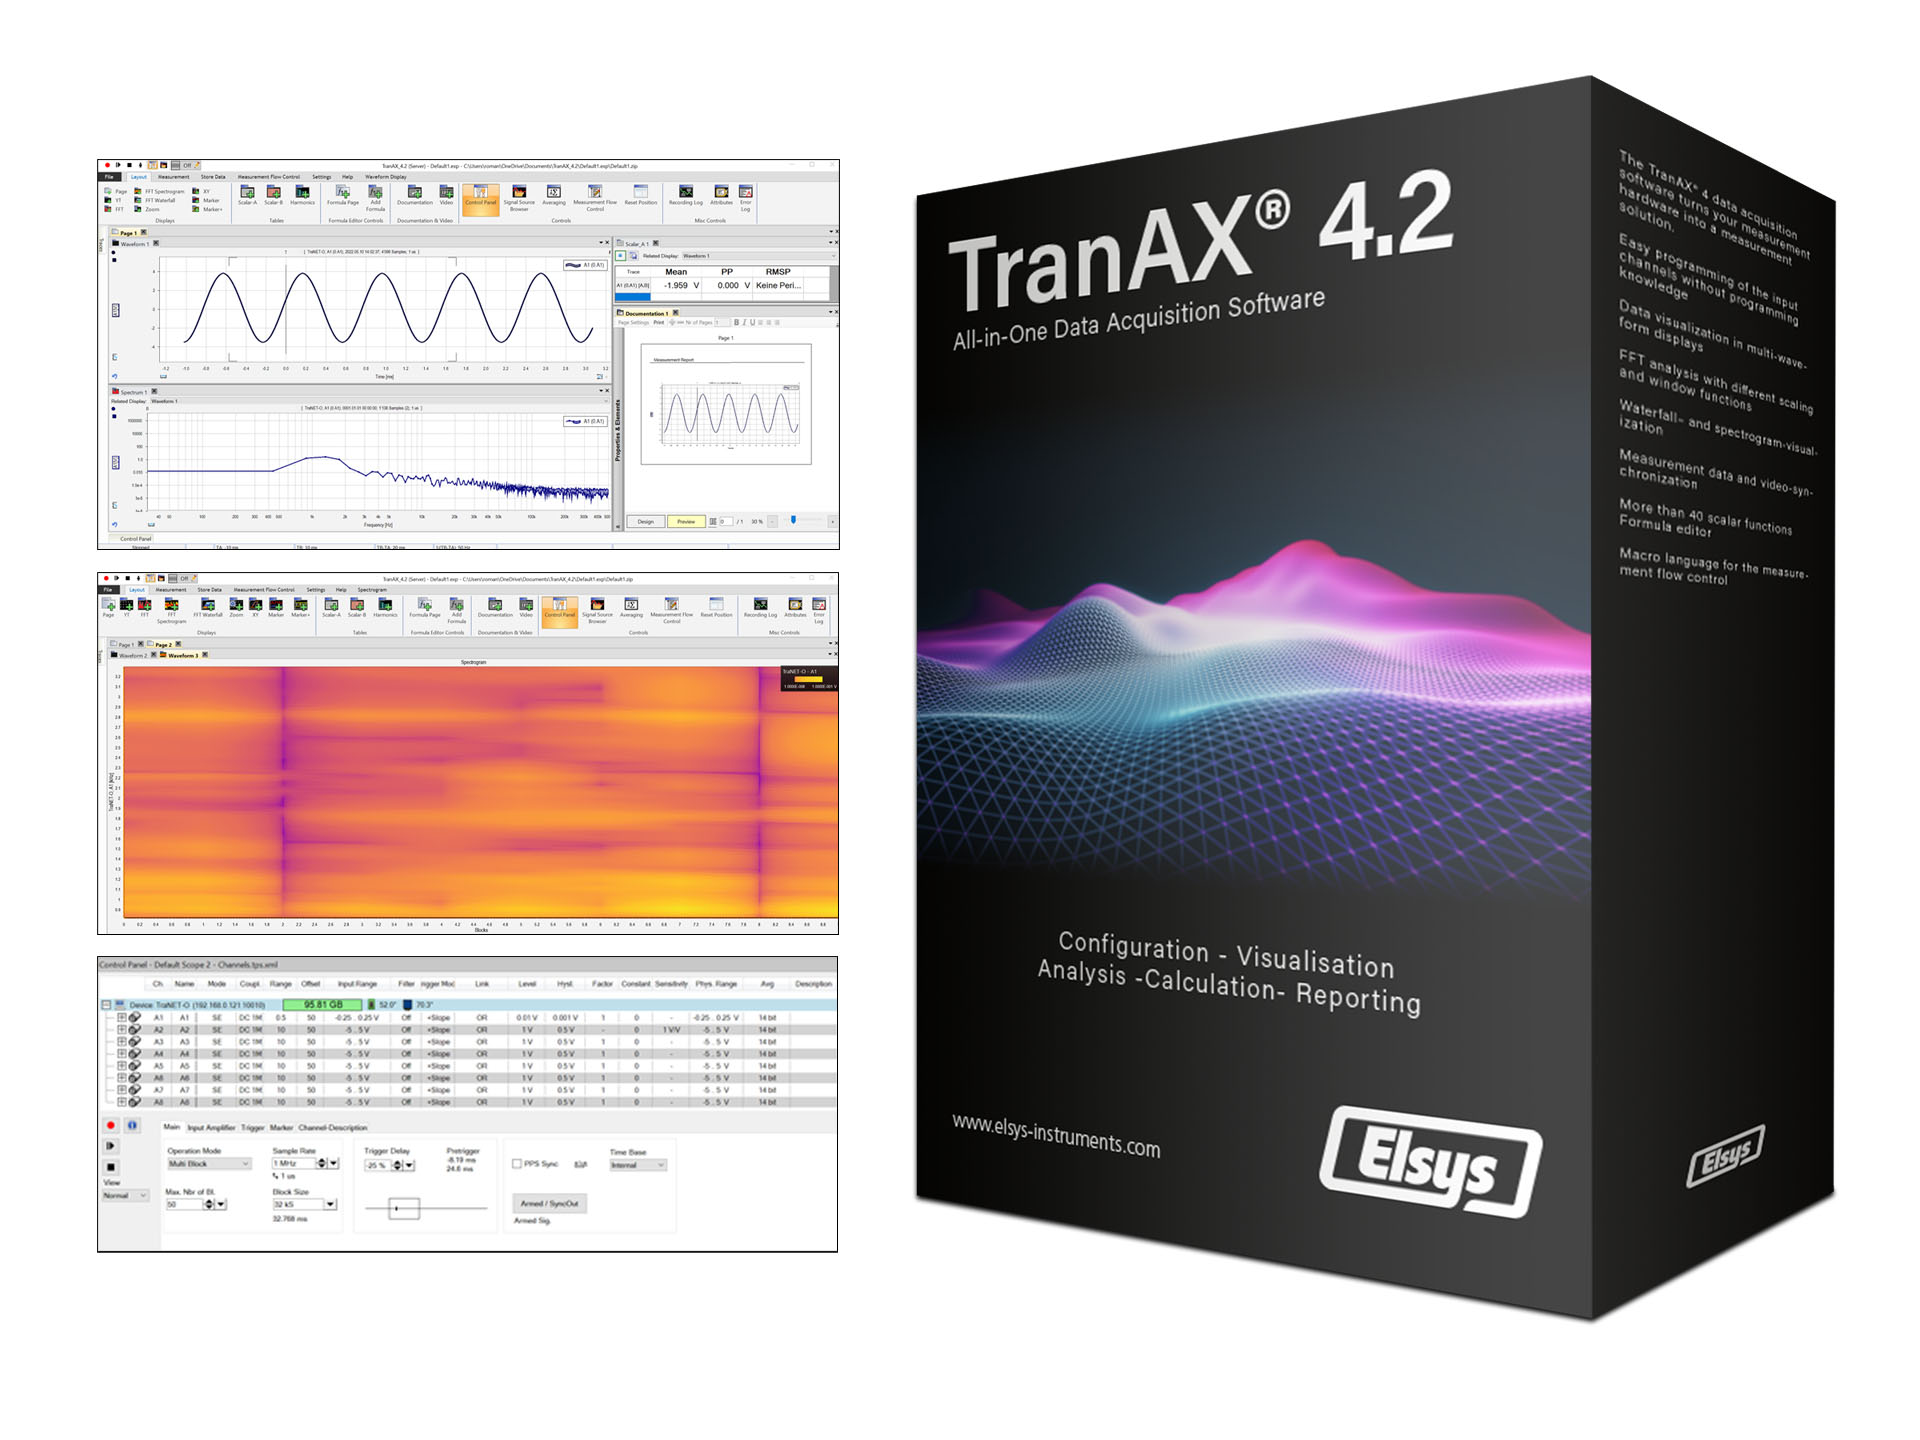
TranAX® 4
The TranAX® 4 data acquisition software turns your measurement hardware into a measurement solution.
- Easy programming of the input channels without programming knowledge
- Data Visualization in Mulit-Waveform Displays
- Multiple cursors allow easy data reading and documentation
- X-Y Waveform
- FFT Analysis with different scaling and window functions
- Waterfall – and Spectrogram-Visualization
- Measurement Data and Video-Synchronization
- More than 40 scalar functions
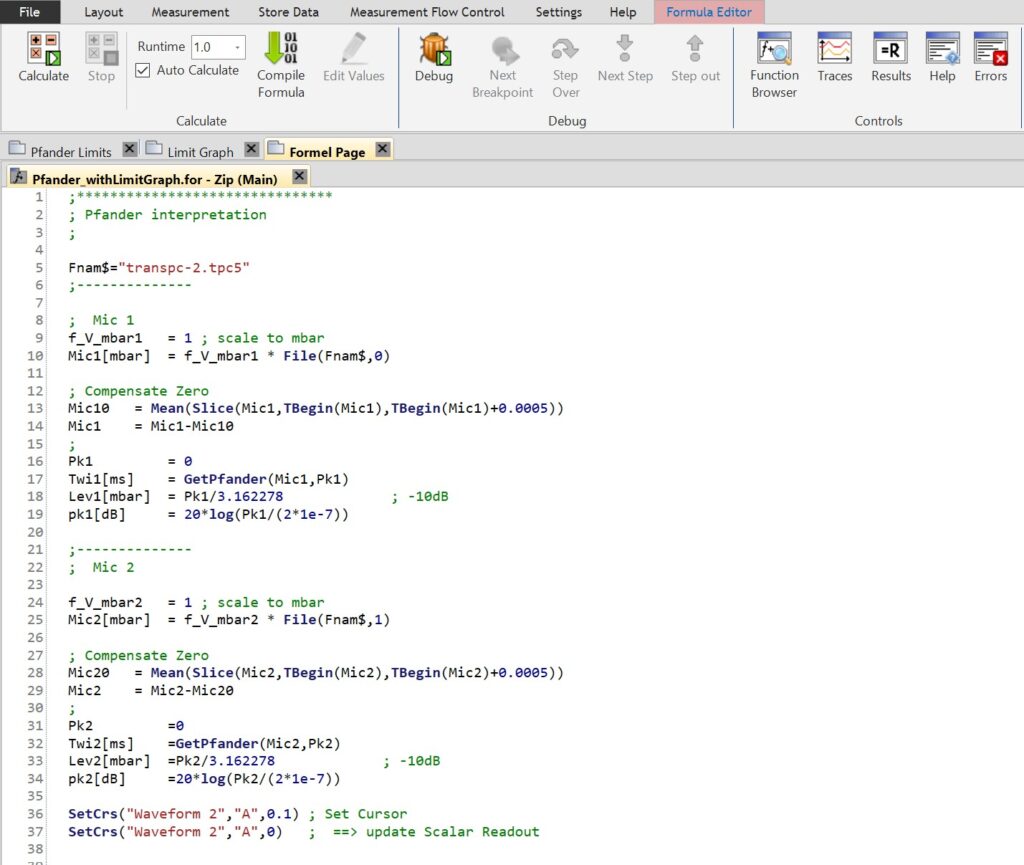
- Formula editor with more than 60 math functions, syntax highlighting, for-loops, if/else conditions, array calculations, etc.
- Macro Language for the measurement flow control
- English and German version
- ActiveX/COM interface for controlling TranAX and reading out data from Excel or customer-specific programs
Key Specification
System requirement
- Compatible with all TraNET devices as well as TPCE, TPCE-LE and TPCX measuring cards
- Client-Server Architecture
- Minimum requirement:
- Windows 10, 64 Bit
- 4 GB RAM
- Full-HD Resolution
Licensing
Full Version
- Paid version
- License key with online or offline activation required
- Unlimited term
- 2 activations per license possible
- Free update within the version number
LE Version
- 30 days trial version with full functionality of the full version, afterwards automatic change to the LE version
- No license key necessary
- Unlimited runtime and installations


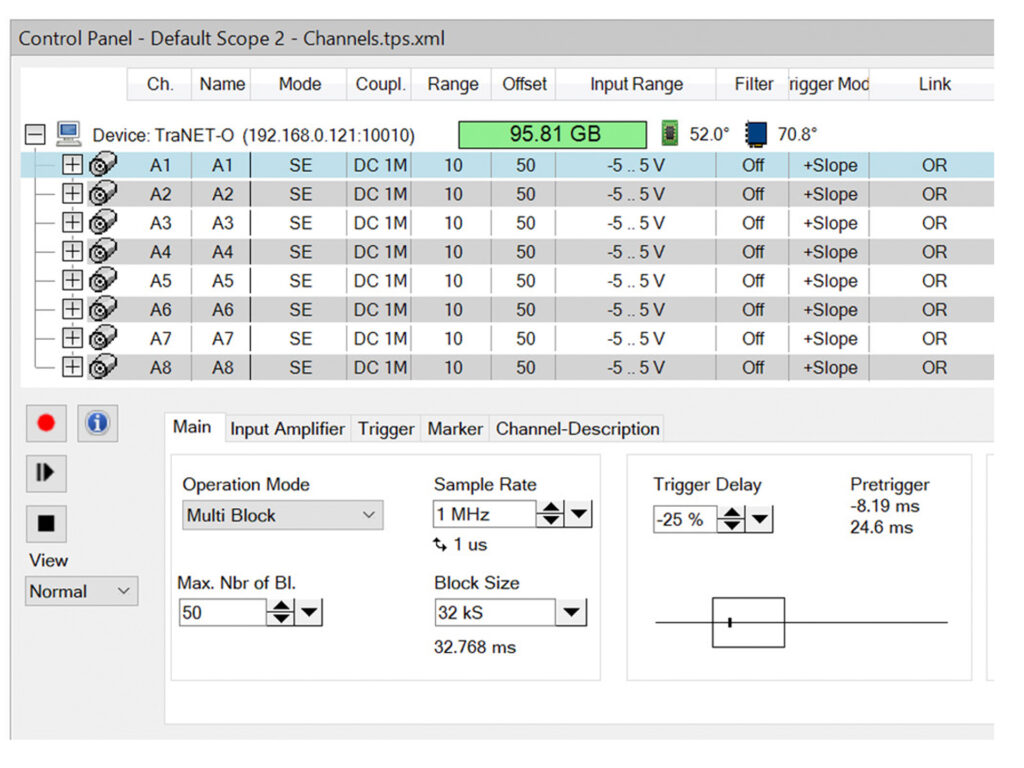
Control-Panel - Hardware Configuration
Easy and fast configuration of input channels and measurement settings in the control panel:
- Setting the input range per channel
- Input coupling (DC / AC / IEPE) configuration
- Trigger configuration
- Hardware filter configuration
- Measurement mode setting (Scope / Mulit-Block / Continuous / ECR)
- Sampling rate and block length setting
- Channel labeling
- Channel scaling in phyiscal units (e.g. Bar or mA)
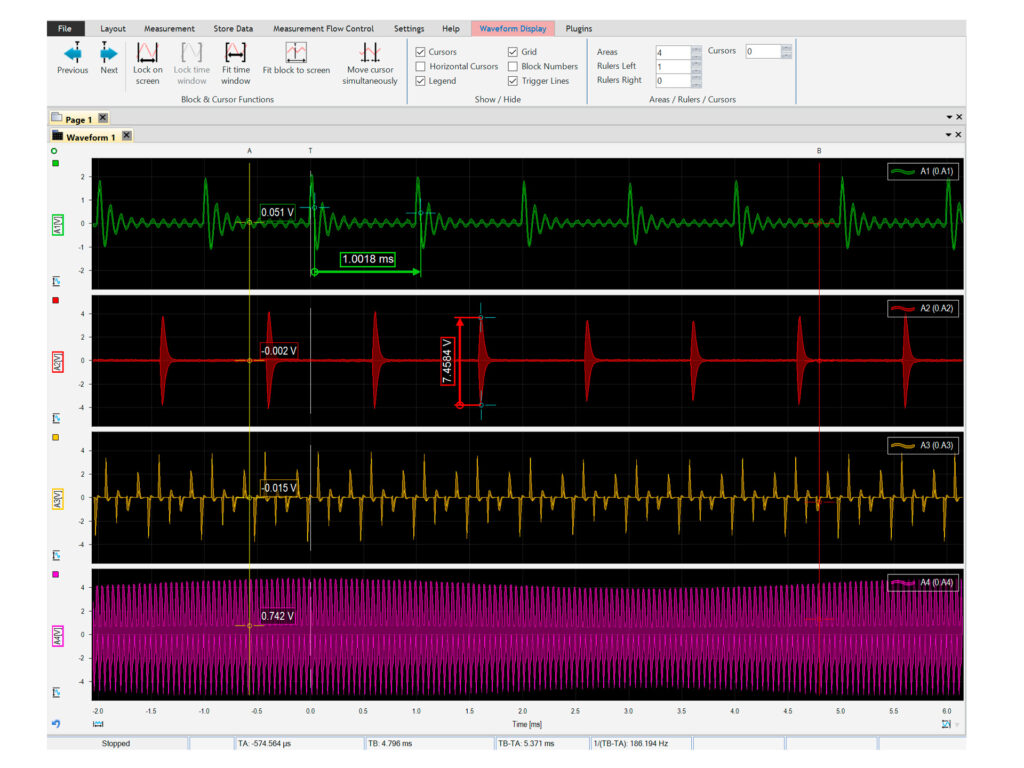
Waveform Display
The measurement curves can be displayed in flexible waveform displays. Individual curves can be displayed on top of each other or in subdivided areas. Curves with different scales or units can be scaled and moved relative to each other with additional Y-axes.
For long-term recordings, the data points are automatically reduced so that even very large measurements can be displayed smoothly. Different scroll modes can be used to always have the best view of the measurement data.
Other features:
- Unlimited number of curves per window
- Flexible zoom options
- White or black background
- Multiple cursors
- Time and amplitude measurement
- Curve legend
- Multiple Y-axes per page
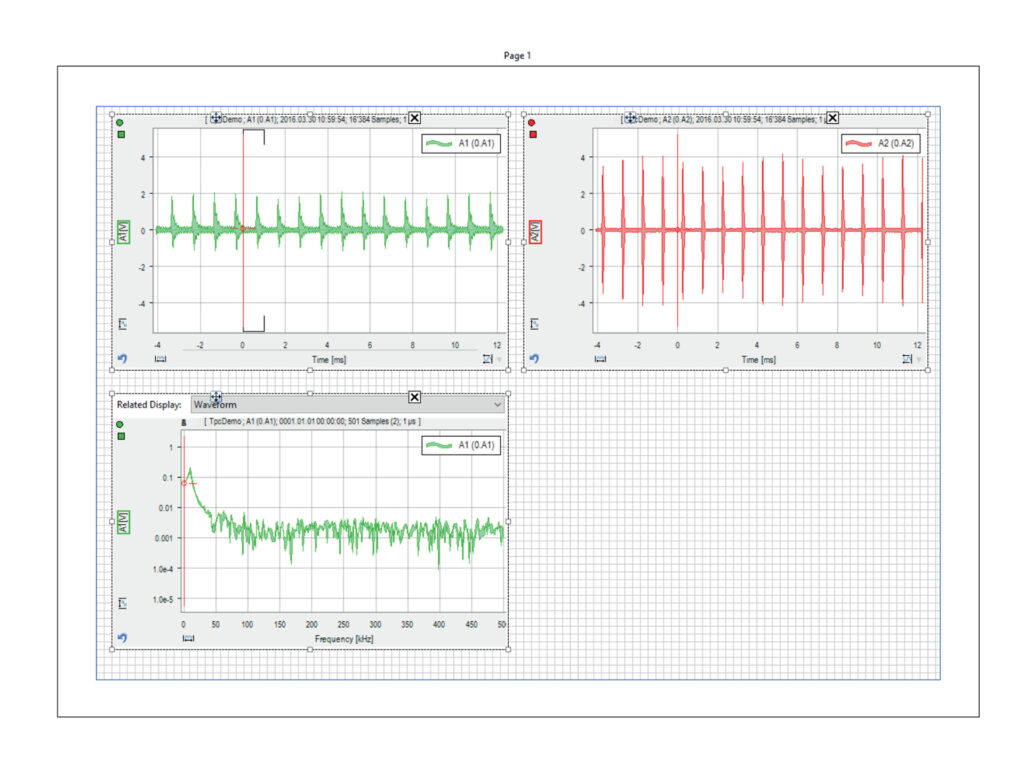
Measurement Report Generator
Creating meaningful measurement reports can be time-consuming. With the documentation page in TranAX you can create them with a few clicks.
Use the already known waveform displays and scale tables and place them freely in a printable format.
- Design a measurement report with just a few clicks
- Long-term recordings can be divided into several pages
- Use templates for a consistent appearance of your reports
- Save screen and print output in the same setting
- Results from the formula editor can be used directly in text fields
- Create automated PDF reports using the measurement flow control (MFC)
Post-Processing
Do you need the measurement data at a later time for further analysis? No problem with TranAX. Use the same software for measurement and analysis without the need to reorder your signals.
More complex analyses and post-processing can also be performed in TranAX using the Formula Editor. Over 60 integrated and documented functions are available for application-specific evaluations. The calculated measurement curves can be visualized directly on the display.
Application Examples:
- Signals filtering
- Remove DC Offset
- Cutting out individual batches from a measurement
- Searching for curves at certain levels
- Velocity calculations of light barrier signals
- Statistical evaluations
- And many more…
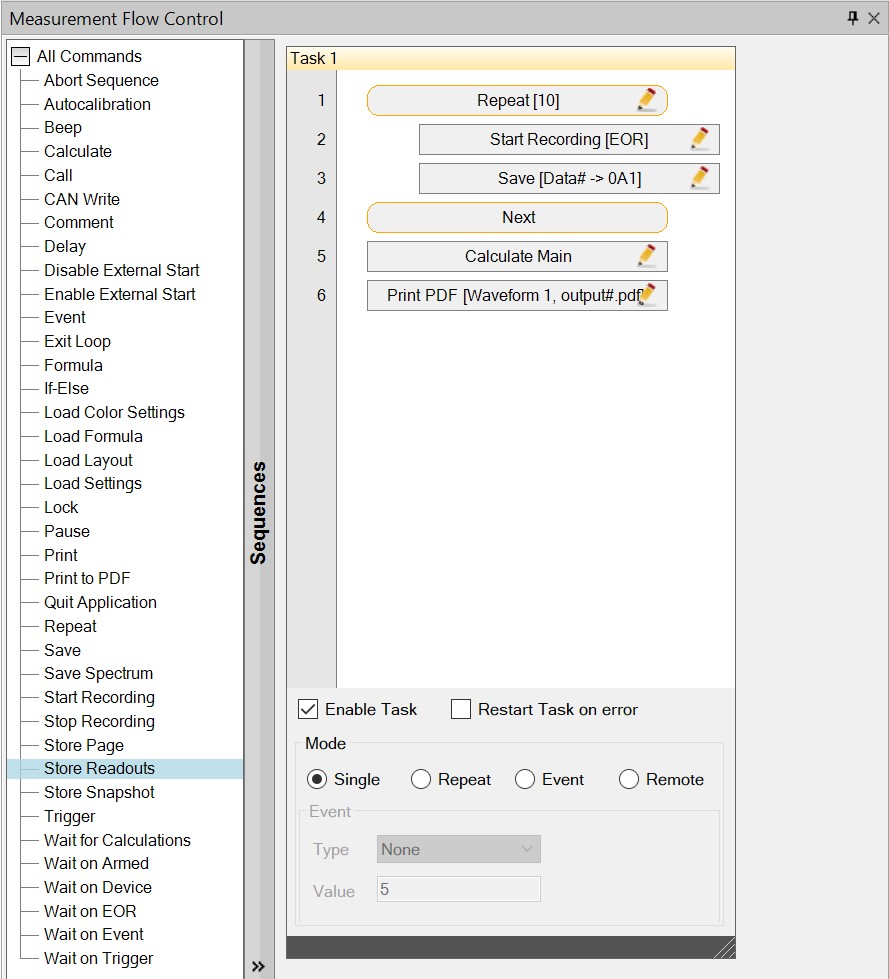
Series Evaluations with the Measurement Flow Control (MFC)
Create automated serial measurements and evaluations thanks to macro-like Measurement Flow Control (MFC):
- Automatically save measurement data with automatic file name assignment.
- Automated loading of layout and hardware settings.
- Execution of external tools with the CALL command.
- Execution of formula calculations at a specific point in time
- Display instructions to the user
- Query variable inputs during the run
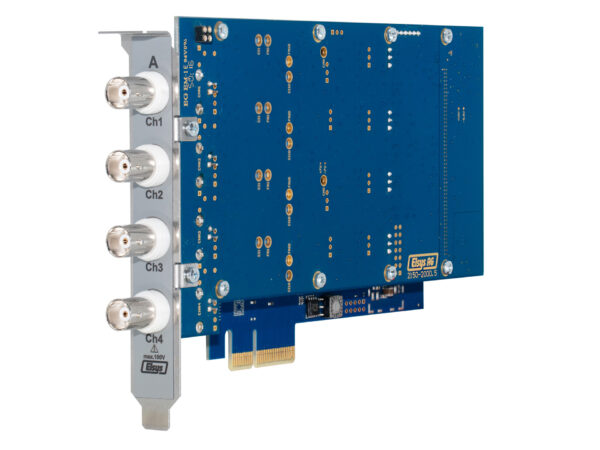
TPCE
High precision and high resolution data acquisition cards, sampling rates from 2 - 240 MS/s per channel and x4 PCIe connectivity.More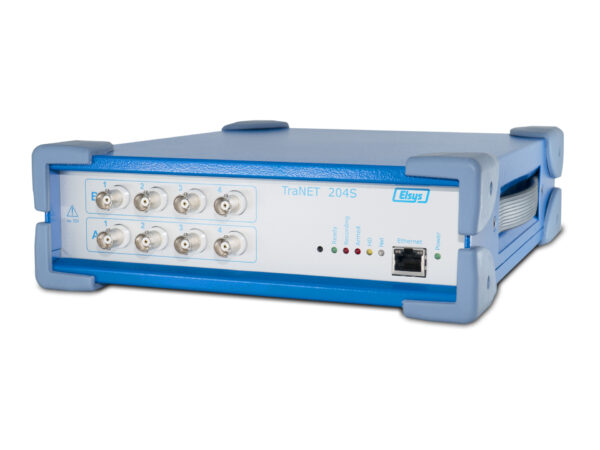
TraNET® FE 204
4 or 8 channel high-speed data acquisition device with Ethernet connection and integrated hard disk.More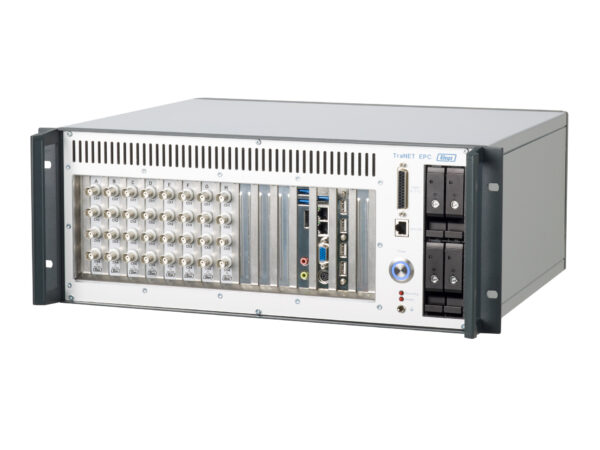
TraNET® EPC
4 to 32 channel high speed data acquisition system ideally suited for large data streams.More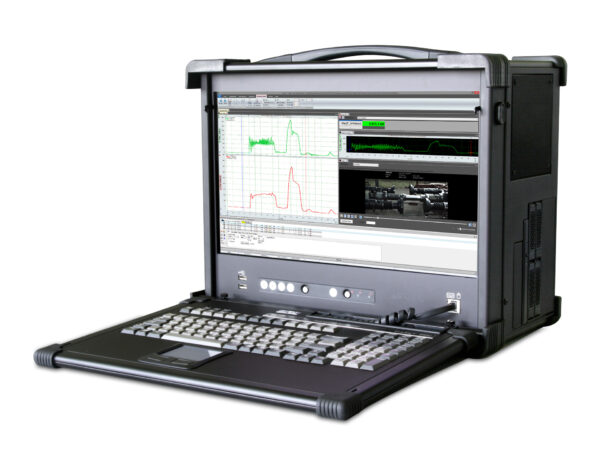
TraNET® PPC
Compact all-in-one data acquisition instrument for up to 24 channels suitable for laboratory or field use.More